In this article, we’ll work through the construction of our own custom Transformer in Pyspark. Transformers act on an input Dataframe, to yield a modified version of the same Dataframe. They form a key component to Pipelines, where a series of Transformers can be chained together to perform all the required data processing.
Table of Contents

Build a Custom Transformer in Pyspark with 1 Easy Example – image by author
What is a Transformer in Pyspark?
As mentioned in a previous article, a Pyspark Transformer is a class that takes in a Dataframe, and return a modified form of the Dataframe. Typically, although not exclusively, this modification comes in the form of an additional column, that contains the results of a calculation. These classes are required to have a transform method.
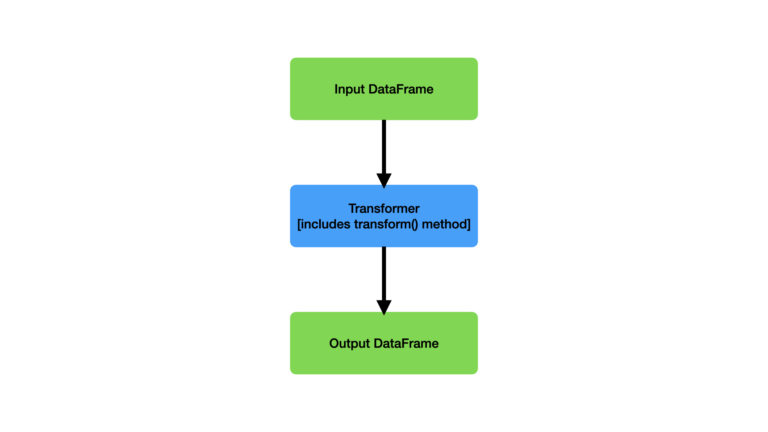
A high-level overview, of how a Transformer works, is illustrated in Figure 1:

Figure 1: Illustration of a Transformer, and its inputs and outputs. The input Dataframe is passed in through the transform() method, and the output Dataframe is returned.
The use of Transformers helps to create modular, reusable code. When defining our own Transformers, there are a couple of points to consider:
- The class must inherit the Pyspark Transformer abstract class
- If you want the ability to save/load your Transformer, the class should also inherit the DefaultParamsReadable and DefaultParamWritable Pyspark classes
We will get into more details as we work through an example. So without any further delay, let’s jump into the code!
Custom Transformer in Pyspark Example
Let’s now work through the implementation of a custom Pyspark Transformer. We will incorporate this Transformer into a pipeline to complete a modeling job.
The aim of this pipeline will be to make use of a Decision Tree Regressor to predict housing values. We will make use of the California Housing Prices dataset. These data were briefly explored in a previous article, and as such I won’t repeat that analysis here.
We can start by importing the necessary packages, and setting up our spark session:
import findspark
findspark.init("/opt/homebrew/Cellar/apache-spark/3.5.0/libexec")

from sklearn.datasets import fetch_california_housing
from typing import Any
import matplotlib.pyplot as plt
from pyspark.sql import SparkSession
from pyspark import keyword_only
from pyspark.sql import functions as F
from pyspark.sql import dataframe as DataFrame
from pyspark.ml import Transformer, Pipeline
from pyspark.ml.pipeline import PipelineModel
from pyspark.ml.param.shared import HasInputCols, HasOutputCol, Param, Params, TypeConverters
from pyspark.ml.util import DefaultParamsReadable, DefaultParamsWritable
from pyspark.ml.feature import VectorAssembler
from pyspark.ml.regression import DecisionTreeRegressor
spark = SparkSession.builder.appName("test").getOrCreate()
Dataset
Now let’s obtain the data we will work with:
# obtain data
data = fetch_california_housing(as_frame=True)
dfX = data["data"]
sY = data["target"]

dfX.head(5)
Since I’ll be using a Decision Tree to model these data, the preprocessing work we’ll have to do is minimal. Nonetheless, here we will focus on the Latitude and Longitude columns, and attempt to convert these values into categories based on their rough groupings. Our custom Transformer will aim to do just that.
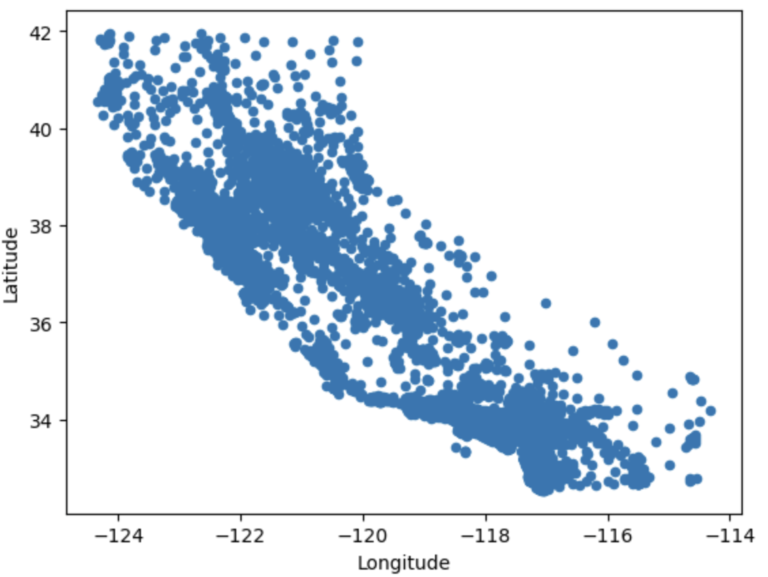
First let’s take a peek to see what the distribution of Latitude and Longitude looks like:
dfX.plot.scatter(x='Longitude',y='Latitude')
plt.show()
We can make out the rough shape of California in this plot. It is evident that the distribution is grouped at various points on the map. Normally, we would assign labels to these groupings through some data-driven technique (e.g. KMeans). However, for the purpose of this demonstration, I will build a simple Transformer to handle this task. The Transformer will partition the data based upon very simple hand-written rules. Keep in mind the intent here is to demonstrate how to build a Transformer, and not to yield the best results for this particular problem.
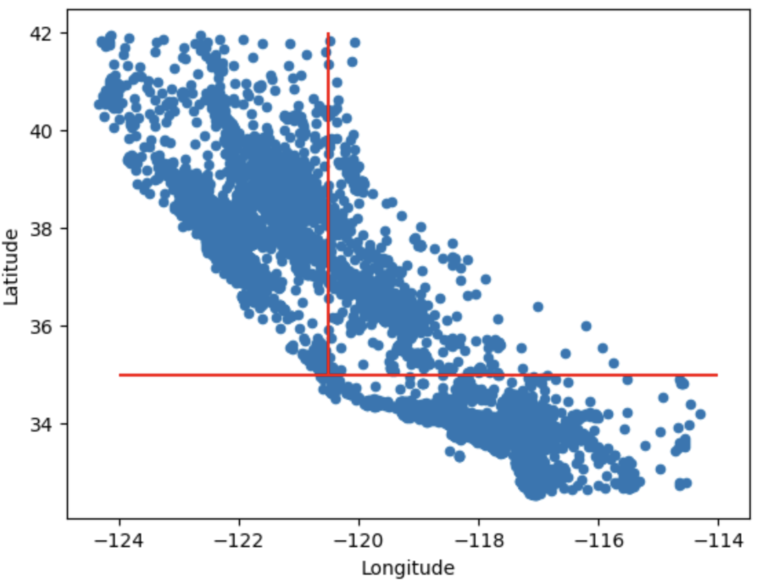
The figure below illustrates how labels will be assigned based on geographical location:

Figure 2: Division of latitude and longitude points into 3 regions. The dividing lines are indicated in red
The Latitude and Longitude points in the data will be split into 3 groups. These are labelled as:
- South
- North
- Interior
All points at or below Latitude 35 will be assigned to group 1 (South). All points above Latitude 35, and less than or equal to Longitude -120.5 we be assigned to group 2 (North). All remaining points are given to group 3 (Interior).
Before proceeding, let’s place our data into a Pyspark Dataframe:
dfX["MedHouseVal"] = sY
df = spark.createDataFrame(dfX)
Custom Transformer
Now that we know what needs to be done, let’s build a new transformer called AssignRegion. We can start with the class definition, unique parameter setup, and initialization function:
class AssignRegion(Transformer, HasInputCols, HasOutputCol, DefaultParamsReadable, DefaultParamsWritable):
    """
    Class to convert latitude and longitude into a geographical region within California (either 1, 2, or 3)
    """
    verbose = Param(
        Params._dummy(),
        "verbose",
        "Boolean to determine if transformer prints out status when running.",
        typeConverter=TypeConverters.toBoolean,
    )

    @keyword_only
    def __init__(self,
                 inputCols: list=[],
                 outputCol: str='',
                 verbose: bool=False) -> None:
        """
        Function to initialise the class instance
        """
        super().__init__()
        self._setDefault(inputCols=[], outputCol='', verbose=False)
        kwargs = self._input_kwargs
        self.set_params(**kwargs)
There are a few interesting things to note with this section of code:
- In addition to inheriting Transformer, DefaultParamsReadable, and DefaultParamsWritable, this class is also inherits HasInputCols and HasOutputCol. These Mixins are used to define a list of input columns, and a single output column, respectively.
- When we want to create an input that isn’t defined by a Pyspark Mixin, we will have to define it ourselves. This is the case for the verbose parameter, which will be a boolean to specify if extra information will be printed at runtime. I have written the definition of this parameter immediately before the initialization function (lines 5 to 10).
- The initializer function proceeds in the following way:
- The initializers of the parent classes are called
- Default values for the 3 input arguments are set
- Input keyword arguments are read and set
    @keyword_only
    def set_params(self,
                   inputCols: list=[],
                   outputCol: str='',
                   verbose: bool=False) -> None:
        kwargs = self._input_kwargs
        self._set(**kwargs)

    def setVerbose(self, new_verbose: bool) -> Any:
        return self.setParams(verbose=new_verbose)

    def getVerbose(self) -> bool:
        return self.getOrDefault(self.verbose)
Here we define the set_params function used in the initializer, as well as functions to set and retrieve the value of the verbose input parameter.
    def _transform(self, df: DataFrame) -> DataFrame:
        """
        Function to determine the region based off of the latitude and longitude values
        """
        # read in the transformer parameters
        inputCols = self.getInputCols()
        outputCol = self.getOutputCol()
        verbose = self.getVerbose()

        # return the dataframe with geographical regions included
        try:
            df = df.withColumn(outputCol,
                               F.when( F.col(inputCols[0]) <= 35, 1 )
                               .when( (F.col(inputCols[0]) > 35) & (F.col(inputCols[1]) <= -120.5), 2 )
                               .otherwise(3)
                              )
            if verbose:
                print("Our transformer works!")
        except Exception as e:
            if verbose:
                print(f"Something went wrong, {e}")
            pass
        return df
The _transform function is where the main action happens. This is where we can define our logic to process the incoming Dataframe. First, you can see that we read the transformer parameters, and then attempt to add a new column with the geographical region. This function executes when the transform method is called on the class instance.
Testing the Custom Transformer
Now that the implementation is done, we can test out our transformer to verify that it works. Let’s create an instance, and then pass our data through it:
t = AssignRegion(inputCols=['Latitude','Longitude'], outputCol='Region', verbose=True)
df = t.transform(df)
Our transformer works!
df.groupby('Region').count().show()
Our simple transformer appears to be working with our data!
Using our Transformer in a Pipeline
The strength of writing our own Transformers comes when applying them within a machine learning pipeline. Here we’ll now incorporate an instance of AssignRegion into a pipeline to model our data.
Let’s start by doing a train-test split on the available data:
# split the data into training and test sets
dfTrain, dfTest = df.randomSplit([0.8,0.2])
As mentioned previously, I’ll be making use of a Decision Tree Regressor to model these data. Now we can implement a pipeline, train it, and then view the results on the test set:
# define the pipeline
cols = dfTrain.columns
cols.remove('MedHouseVal')
cols.remove('Latitude')
cols.remove('Longitude')
pipeline = Pipeline(stages=[
    AssignRegion(inputCols=['Latitude','Longitude'], outputCol='Region'),
    VectorAssembler(inputCols = cols, outputCol="Features"),
    DecisionTreeRegressor(featuresCol = 'Features', labelCol = 'MedHouseVal', maxDepth = 5)
])

# train the pipeline
model = pipeline.fit(dfTrain)

# make predictions on the test set
dfPred = model.transform(dfTest)

dfPred.select("MedHouseVal","prediction").show(5)
It is evident that the pipeline model is working as expected.
Another nice benefit of pipelines is that we can save our entire trained workflow, for use at a later time. Let’s try to save our pipeline, load it, and make use of the loaded instance:
# write the trained model to disk
model.write().overwrite().save("./trained_pipeline")

# load the saved model, and confirm it works
model2 = PipelineModel.load("./trained_pipeline")

dfPred = model2.transform(dfTest)
dfPred.select("MedHouseVal","prediction").show(5)
This result is exactly the same as that obtained above.
Final Remarks
In this post you have learned:
- What a Pyspark Transformer is.
- How to build your own Transformers in Pyspark.
- How to implement a custom Transformer within a Pyspark pipeline.
I hope you enjoyed this article, and gained some value from it. If you would like to take a closer look at the code presented here, please take a look at my GitHub. If you have any questions or suggestions, please feel free to add a comment below. Your input is greatly appreciated.
Related Posts
About Author
Hi I'm Michael Attard, a Data Scientist with a background in Astrophysics. I enjoy helping others on their journey to learn more about machine learning, and how it can be applied in industry.
