In this post, I’ll cover how to implement a Pyspark pipeline. A Pipeline object is composed of a series of transformers and estimators, that encapsulate a data processing workflow. Pipelines facilitate the organisation of modular components of code, and provide a convent means of saving, and loading, entire Pyspark data processing sequences. In addition, pipelines enable data scientists to perform cross-validation over an entire modeling project that is composed of various steps (pre-processing, modeling, post-processing).
Table of Contents

Building a Pyspark Pipeline with 1 Simple Example – image by author
What is a Pyspark Pipeline?
A pipeline is a software architecture that consists of executing various processing steps in sequence, on the available data. Each processing step can be termed a stage, or step, in the pipeline. There are various ways to make use of pipelines when organising a project. For instance a single pipeline, with steps performing pre-processing, modelling, and post-processing, can run an entire machine learning application. Alternatively, it is possible to build individual pipelines to perform preprocessing, modelling, and post-processing separately for more complex projects. The exact way you implement a pipeline is up to you!
For a newly created Pyspark pipeline, the various steps will consist of one of the following types of objects:
- Transformer: a Pyspark transformer takes in a Dataframe, and return a modified form of the Dataframe. Typically, this modification will come in the form of an additional column containing the results of a particular calculation. It is required to have a transform method.
- Estimator: a Pyspark estimator takes in a Dataframe, and returns a transformer. It is required to have a fit method.
After it is assembled, the pipeline can be trained like any other Pyspark model. Training is accomplished by calling the fit method on the pipeline instance. The result of this is a pipeline model that is composed entirely of transformers, and can be used to generate predictions. This arrangement is illustrated in Figure 1 below:
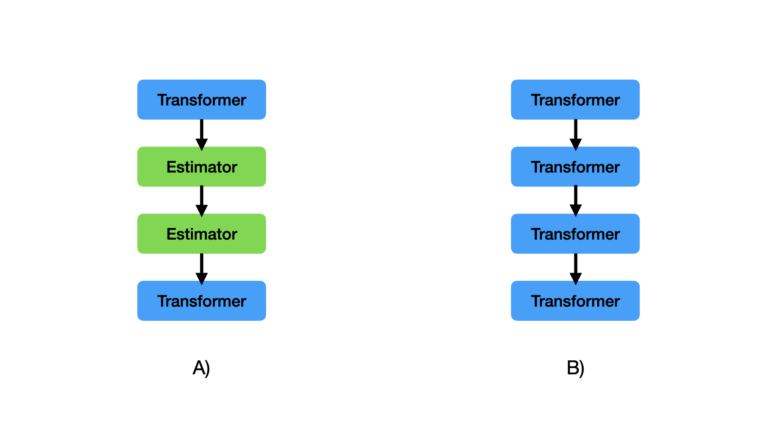
Figure 1: Illustration of an example pipeline (A) and pipeline model (B). A pipeline is composed of transformers and estimators, with a specific direction of data flow (indicated by arrows from top to bottom). A pipeline model is composed exclusively of transformers, that have the same direction of data flow.
Benefits of Using Pyspark Pipelines?
Structuring our code into pipelines helps to facilitate many benefits. These consist of:
- Modular Code: each stage can be designed to operate independently and to fulfil a specific task. This helps to create a reusable code base.
- Understanding the Code: looking at the pipeline will quickly reveal what actions are being done by the software, and in what order. This helps with quickly gaining a holistic picture of what the code does.
- Enhance Automation: a pipeline is an ideal structure for organising production quality code for ETL (Extraction-Transform-Load) operations. The expectation is that the system will operate independently over some extended period of time.
- Facilitate Scalability: stages can be added or removed as is needed by the application.
- Model Management: an entire pipeline model can be saved to disk, for use at a later time. Therefore various versions of a pipeline model can be stored, which can help with experiment tracking and project fault tolerance.
Pyspark Pipeline Example
We can now move on to implement a pipeline in Pyspark! In this example, we’ll build the code required to prepare a regression dataset, and fit a Linear Regression model. Let’s start by importing all the necessary packages:
import findspark
findspark.init("/opt/homebrew/Cellar/apache-spark/3.5.0/libexec")

from sklearn.datasets import fetch_california_housing
import matplotlib.pyplot as plt
from pyspark.sql import SparkSession
from pyspark.sql import functions as F
from pyspark.ml import Pipeline
from pyspark.ml.pipeline import PipelineModel
from pyspark.ml.feature import VectorAssembler, StandardScaler
from pyspark.ml.regression import LinearRegression
from pyspark.ml.functions import vector_to_array
spark = SparkSession.builder.appName("pipelines").getOrCreate()
Dataset
Now let’s obtain some data to work with. I’ll be making use of the California Housing dataset:
# obtain data
data = fetch_california_housing(as_frame=True)
dfX = data["data"]
sY = data["target"]

dfX.head(5)
We can generate a box plot of the input features, and a histogram of the target, to aid in exploring these data:
dfX.boxplot(column=dfX.columns.tolist(), rot=45)
plt.xlabel("feature")
plt.ylabel("amount")
plt.show()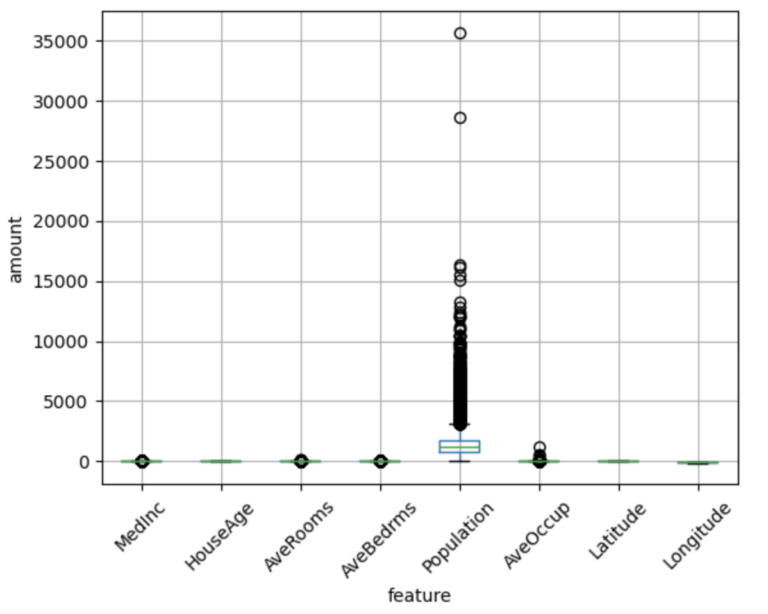
sY.hist()
plt.xlabel("median house value")
plt.ylabel("frequency")
plt.show()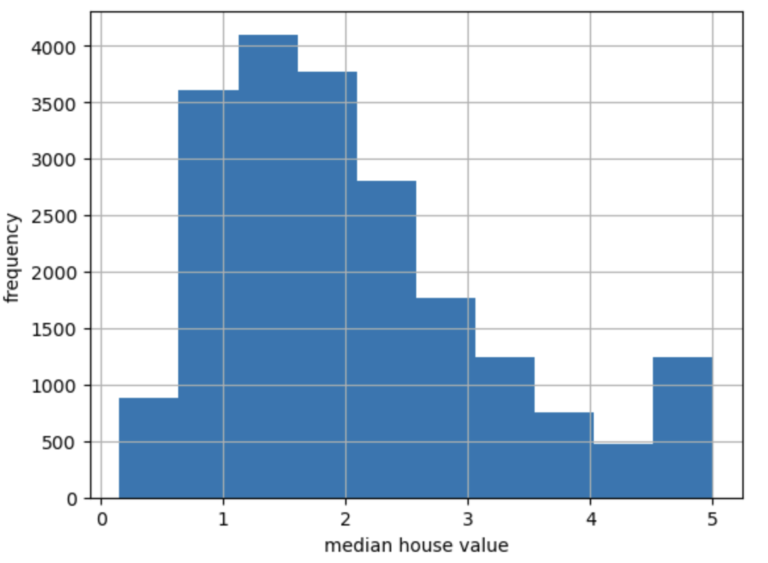
Since we’ll be using linear regression to model these data, all of the input features should be standardized. To simplify the example here, I won’t consider any treatment of the non-normal appearance of the target label.
Before proceeding, let’s place our data into a pyspark dataframe, and perform a train-test split:
# package the data into a pyspark dataframe
dfX["MedianHouseValue"] = sY
df = spark.createDataFrame(dfX)

# perform a train-test split
dfTrain, dfTest = df.randomSplit([0.8,0.2])
print(f"Total number of samples in dataset: {df.count()}, training samples: {dfTrain.count()}, testing samples: {dfTest.count()}")
Total number of samples in dataset: 20640, training samples: 16512, testing samples: 4128
Assembling the Input Features
To start, we’ll need to capture all the input features into a single vector column. We can make use of Pyspark’s VectorAssembler to accomplish this:
# gather all input features into a single vector column called features
cols = dfTrain.columns[:-1]
assembler = VectorAssembler(inputCols = cols, outputCol="Features")
dfTrain = assembler.transform(dfTrain)
dfTrain.show(5)
It is clear that the column Features contains lists of all the entries contained in the cols columns.
Standardizing the Input Features
We can make use of Pyspark’s built-in StandardScaler to transform all the input features to have a mean of 0, and standard deviation of 1. Let’s test this out, and visualize the results:
# setup the scaler, and train it, and create a new column with our standardised features
scaler = StandardScaler(withMean=True, withStd=True, inputCol="Features", outputCol="StandardFeatures")
model  = scaler.fit(dfTrain)
dfTrain = model.transform(dfTrain)

dfPlot = (
    dfTrain
    .select("StandardFeatures")
    .withColumn("Features", vector_to_array("StandardFeatures"))
    .select([F.col("Features")[i] for i in range(len(cols)) ])
    .toPandas()
)

dfPlot.boxplot(column=dfPlot.columns.tolist(), rot=45)
plt.xlabel("feature")
plt.ylabel("amount")
plt.show()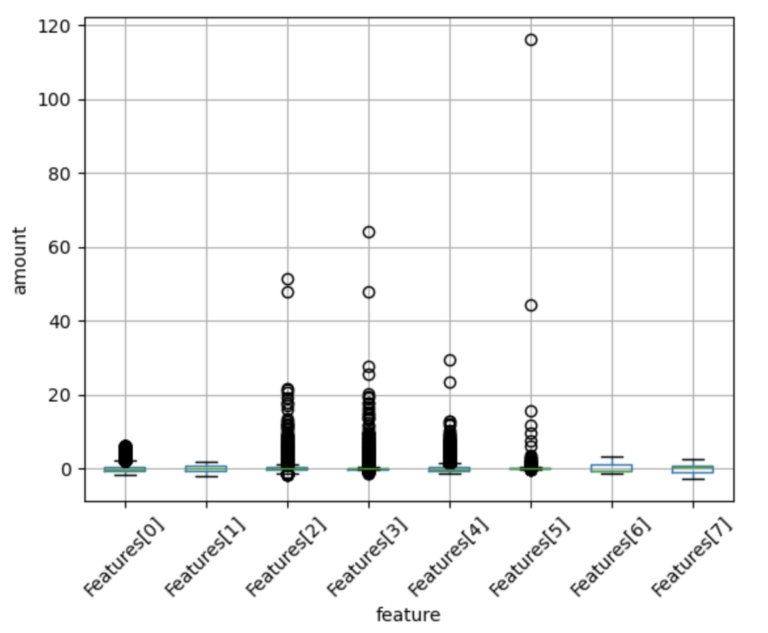
We can zoom in a bit more, to ignore the effects of the outliers:
ax = dfPlot.boxplot(column=dfPlot.columns.tolist(), rot=45)
ax.set_ylim(-5, 5)
plt.xlabel("feature")
plt.ylabel("amount")
plt.show()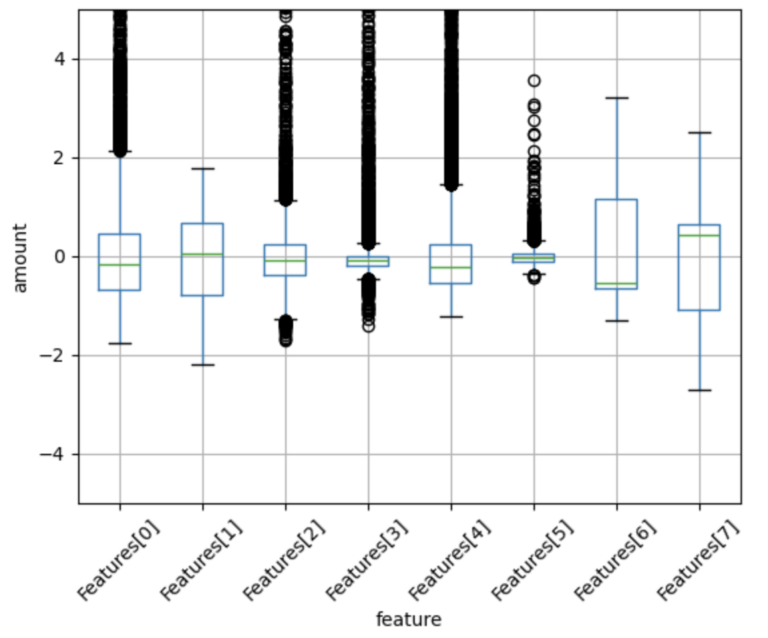
We can see that the StandardScaler has transformed our data, such that all the features exist at similar scales. It is important to note that differences do persist between the features, however (i.e. number and distribution of outliers, range of quartiles, etc).
Linear Regression Modelling
Let’s now attempt to model our data, using the Linear Regression estimator available in Pyspark:
# declare a linear regression model, and train it
linear_reg = LinearRegression(featuresCol = 'StandardFeatures', labelCol = 'MedianHouseValue', regParam = 0.01)
model = linear_reg.fit(dfTrain)

# make predictions on the training set
dfPred = model.transform(dfTrain)
dfPred.select("MedianHouseValue","prediction").show(5)
It is clear that the model is working: we are able to train it on our data, and use the trained model to generate predictions.
Putting it All Together: Build a Pyspark Pipeline
Instead of running the previous steps separately, we can integrate them all together into a single Pipeline object. Once we have this, we can test out our implementation on the held-out test set. Let’s go ahead and do this now:
# regenerate our training and test sets
n_count = df.count()
dfTrain = df.limit(int(n_count*0.8))
dfTest  = df.subtract(dfTrain)

# define the pipeline
cols = dfTrain.columns[:-1]
pipeline = Pipeline(stages=[
    VectorAssembler(inputCols = cols, outputCol="Features"),
    StandardScaler(withMean=True, withStd=True, inputCol="Features", outputCol="StandardFeatures"),
    LinearRegression(featuresCol = 'StandardFeatures', labelCol = 'MedianHouseValue', regParam = 0.01)
])

# train the pipeline
model = pipeline.fit(dfTrain)

# make predictions on the test set
dfPred = model.transform(dfTest)
dfPred.select("MedianHouseValue","prediction").show(5)
It is evident that the pipeline model is working correctly.
Another nice benefit of pipelines is that we can save our entire workflow, for use at a later time. To save our current pipeline, and reload it into another instance, we can run:
# write the trained model to disk
model.write().overwrite().save("./trained_pipeline")

# load the saved model, and confirm it works
model2 = PipelineModel.load("./trained_pipeline")

dfPred = model2.transform(dfTest)
dfPred.select("MedianHouseValue","prediction").show(5)
This result is exactly the same as the one obtained above.
Final Remarks
In this post you have learned:
- What a Pyspark pipeline is.
- Why it can be beneficial to use pipelines in your machine learning project.
- How to implement a Pyspark pipeline, using transformers and estimators available from the Pyspark API.
I hope you enjoyed this article, and gained some value from it. If you would like to take a closer look at the code presented here, please take a look at my GitHub. If you have any questions or suggestions, please feel free to add a comment below. Your input is greatly appreciated.
Related Posts
Hi I'm Michael Attard, a Data Scientist with a background in Astrophysics. I enjoy helping others on their journey to learn more about machine learning, and how it can be applied in industry.
