The Cross Entropy Loss is a standard evaluation function in machine learning, used to assess model performance for classification problems.  This article will cover how Cross Entropy is calculated, and work through a few examples to illustrate its application in machine learning.

cross entropy loss

A Simple Introduction to Cross Entropy Loss – image by author

What is Cross Entropy?

Cross Entropy has its origins with the development of information theory in the 1950’s. In this post, we will strictly concern ourselves with the application of cross entropy as a loss function. This loss function is used during training for classification machine learning models.

In an earlier article I introduced the Shannon Entropy, which is a measure of the level of disorder in a system. For discrete problems with class labels c \in C, the probability of obtaining a specific c from a random selection process is given by p_c. The Shannon Entropy is given by:

H(p_c) = -\sum_c p_c log_2 (p_c)

Cross Entropy provides a measure of the amount information required to identify class c, while using an estimator that is optimised for distribution q_c, rather than the true distribution p_c. This quantity is given by:

H(p_c,q_c) = -\sum_c p_c log_2 (q_c)    (1)

Like the Shannon Entropy, this is a positive quantity (\gt 0) that is measured in bits.

We can plot the form of this function to gain a better intuition for what we are dealing with. To do this, let’s consider the simplified form of equation (1) with only two classes: c \in \{c_1,c_2\}.

H(p_c,q_c) = -p_c log_2 (q_c) -(1.0-p_c) log_2 (1.0-q_c)    (2)

where p_{c_1} = p_c, q_{c_1} = q_c, and p_{c_2} = 1.0 – p_c, q_{c_2} = 1.0 – q_c.

cross entropy loss

Figure 1: Cross Entropy as a function of p_c and q_c, for the specific case where there are only 2 classes (see equation (2)). The height along the vertical axis H represents the magnitude of the Cross Entropy for the particular input parameter values. 

We can see that the Cross Entropy increases as the difference between the two distributions, p_c and q_c, increases. Maximum values are approached as p_c \rightarrow 0.0 & q_c \rightarrow 1.0, or p_c \rightarrow 1.0 & q_c \rightarrow 0.0. Conversely, minimum values are present where p_c \approx q_c. We can therefore see that H(p_c,q_c) can be interpreted as a measure of difference between the values p_c and q_c.

Application in Machine Learning

In the context of machine learning, H(p_c,q_c) can be treated as a loss function for classification problems. The distribution q_c comes to represent the predictions made by the model, whereas p_c are the true class labels encoded as 0.0‘s and 1.0‘s. To make this interpretation more transparent, we can rename these distributions as y_{true} = p_c and y_{pred} = q_c. Equation (1) makes for a good loss function as it is a differentiable function of y_{pred}, thereby making it amenable to optimisation techniques like gradient descent.

Looking back at the 2-class example represented by equation (2), this becomes a binary classification problem where y_{true} \in \{0.0,1.0\}. In general, Cross Entropy can be used for problems with an arbitrary number classes.

Let’s implement a function in Python to compute the Cross Entropy between distributions y_{true} and y_{pred}:

import numpy as np

def cross_entropy(y_true: np.array, y_pred: np.array) -> float:
    """
    Function to compute cross entropy for distributions y_true & y_pred
    
    Input:
        y_true : numpy array of true labels
        y_pred : numpy array of model predictions
        
    Output:
        scalar cross entropy value between y_true & y_pred
    """
    offset = 1e-16
    return -np.sum([y_t*np.log2(y_p + offset) for y_t,y_p in zip(y_true,y_pred)])

Note that the offset parameter is used to prevent computation errors following from log(0.0).

Binary Classification Examples of Cross Entropy Loss

We can now work through a couple basic examples involving a binary classification problem. As mentioned before, this entails y_{true} \in \{0.0,1.0\}.

The first example will have prediction values that deviate significantly from the true labels:

# two class example no. 1
y_true = np.array([1.0, 0.0, 0.0, 1.0])
y_pred = np.array([0.8, 0.5, 0.6, 0.4])

print(f'Cross Entropy for example 1 is: {cross_entropy(y_true,y_pred):.2f}')
Cross Entropy for example 1 is: 1.64

The second example will involve prediction values that are much more closely aligned to the truth:

# two class example no. 2
y_true = np.array([1.0, 0.0, 0.0, 1.0])
y_pred = np.array([0.9, 0.1, 0.2, 0.95])

print(f'Cross Entropy for example 2 is: {cross_entropy(y_true,y_pred):.2f}')
Cross Entropy for example 2 is: 0.23

As we would expect, the Cross Entropy is significantly lower for the situation where y_{pred} has values that are more similar to those in y_{true}.

Multi Classification Examples of Cross Entropy Loss

Let’s consider the situation where we have 3 class labels. These classes will be represented through one-hot-encoding:

# set of true labels
y_true_0 = np.array([1.0, 0.0, 0.0])
y_true_1 = np.array([0.0, 1.0, 0.0])
y_true_2 = np.array([0.0, 0.0, 1.0])

For a first example, let’s generate prediction arrays that attempt to reproduce these labels:

# create some predictions
y_pred_0 = np.array([0.6, 0.2, 0.3])
y_pred_1 = np.array([0.5, 0.7, 0.4])
y_pred_2 = np.array([0.3, 0.4, 0.8])

What is our Cross Entropy for this setup?

# evaluate cross entropy for 3-class problem
ce = cross_entropy(y_true_0,y_pred_0) + cross_entropy(y_true_1,y_pred_1) + cross_entropy(y_true_2,y_pred_2)
print(f'Cross Entropy for example 3 is: {ce:.2f}')
Cross Entropy for example 3 is: 1.57

Let’s now try a second set of predictions, where the values are closer to the true labels:

# create some model output
y_pred_0 = np.array([0.8, 0.2, 0.1])
y_pred_1 = np.array([0.2, 0.9, 0.2])
y_pred_2 = np.array([0.1, 0.3, 0.9])

# evaluate cross entropy for 3-class problem
ce = cross_entropy(y_true_0,y_pred_0) + cross_entropy(y_true_1,y_pred_1) + cross_entropy(y_true_2,y_pred_2)
print(f'Cross Entropy for example 4 is: {ce:.2f}')
Cross Entropy for example 4 is: 0.63

Like with the binary classification examples, here we see that as the prediction values approach the true labels, the Cross Entropy decreases.

Final Remarks

In this post you have learned:

  • What is Cross Entropy, and how to calculate it
  • How to apply Cross Entropy as a loss function, in the context of machine learning
  • How to implement the Cross Entropy function in Python

I hope you enjoyed this article, and gained value from it. If you have any questions or suggestions, please feel free to add a comment below. Your input is greatly appreciated.

Related Posts

About Author

Hi I'm Michael Attard, a Data Scientist with a background in Astrophysics. I enjoy helping others on their journey to learn more about machine learning, and how it can be applied in industry.
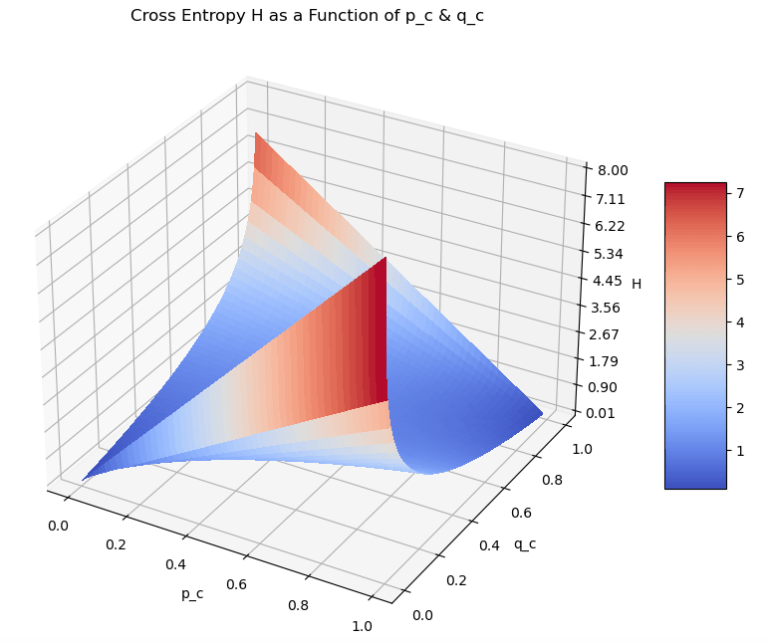
0 0 votes
Article Rating
Subscribe
Notify of
guest

0 Comments
Inline Feedbacks
View all comments
0
Would love your thoughts, please comment.x
()
x
Newsletter Signup